
ASX: LIB / Cuyuni Mining District, Guyana / 21 September 2026
Hard-rock gold confirmed at Oko North
Liberty Metals’ first rock chip assays have returned gold in bedrock across four different host rocks, peaking at 2.32 g/t. The samples carrying gold cluster around the mapped shear zone. Together with the coarse, angular gold recovered from the workings, the results support a primary hard-rock source within Liberty’s own ground, beneath workings that have never been drilled.
55
Rock chips assayed
2.32
g/t Au peak
4
Samples above 1 g/t
4
Host rock types with gold
5,000
Soil samples underway
The results
Liberty collected 55 rock chip samples from priority areas across Oko North during its maiden field campaign. Sampling deliberately excluded material carrying visible gold, so the results measure the bedrock itself rather than nuggets picked from it. This is the first modern exploration ever conducted on the Project.
| Sample | Au g/t | Host rock | Easting | Northing |
|---|---|---|---|---|
| OKRK0047 | 2.32 | Outcropping grey quartz vein, 50cm | 265074 | 714549 |
| OKRK0029 | 1.94 | Sheared granite | 264804 | 714266 |
| OKRK0023 | 1.45 | Clean white quartz vein, 1.5m | 267163 | 715212 |
| OKRK0054 | 1.08 | Red conglomerate, rounded quartz clasts | 262802 | 713797 |
| OKRK0020 | 0.78 | Quartz vein from mullock | 265862 | 716636 |
Gold in four different host rocks
Breadth
The four results above 1 g/t came from a grey quartz vein, sheared granite, a white quartz vein and a conglomerate. Gold spread across several rock types and mineralisation styles points to a broadly mineralised system rather than a single isolated vein.
Visible gold was deliberately excluded
Method
Liberty chose not to sample material carrying visible gold, so the assays reflect the underlying hard rock rather than nuggets. Most early-stage explorers would sample the visible gold and lead with the number. Excluding it gives a cleaner reading of the system.
The highest grade is in outcropping vein
Source
The best result, 2.32 g/t, came from an outcropping grey quartz vein: rock that is still in place, not transported. That is consistent with the gold in the creeks and workings being shed from a nearby hard-rock source.
First modern exploration on the ground
First pass
These are reconnaissance samples from the first field campaign ever run on the Project. They were designed to establish whether the bedrock carries gold, and they have.
Every sample, on the Company’s geology
All 55 rock chips plotted at their published coordinates on the geology Liberty mapped: granite in the north, greenstone in the south, and the shear zone running along the contact between them. The tenement outline and geology are georeferenced from the Company’s own map using five of its labelled samples as control points, accurate to within about three metres at those points. Hover any sample to see how many were taken there and the best result.
How this map was made. Sample positions are plotted directly from the coordinates in Appendix B of the announcement dated 21 September 2026. The tenement outline, geology, shear zones, quartz veins and alluvial workings are traced from the Company’s Figure 2, which was georeferenced against five labelled samples of known position. Traced features are close but not surveyed. Where several samples share a location, the marker shows the highest result. Do not use this plan to determine the location or extent of any permit.
The gold follows the structure
Plotting every sample against the mapped geology shows something the headline results alone do not: the gold is concentrated near the shear zones. In orogenic gold systems like those that host the Oko deposits, shear zones are the plumbing that carried gold-bearing fluids up from depth.
| Result | Samples | Median distance to a mapped shear |
|---|---|---|
| Above 1 g/t | 4 | 330 m |
| 0.1 to 1 g/t | 9 | 354 m |
| Detected, below 0.1 g/t | 14 | 294 m |
| Below detection | 28 | 628 m |
Gold sits twice as close to the shear
Pattern
Samples that returned detectable gold sit a median of around 300 metres from a mapped shear. Samples that returned nothing sit around 630 metres away. All four results above 1 g/t lie within 630 metres of a mapped shear.
Away from the shears, the rock is largely barren
Contrast
Of 16 samples taken more than 700 metres from any mapped shear, only three returned detectable gold, and the best of those was 0.23 g/t. The gold is not evenly spread; it is tied to structure.
The shear runs along the granite-greenstone contact
Setting
The main shear zone follows the boundary between the granite in the north and the greenstone in the south. Sheared contacts between granite and greenstone are the classic host for orogenic gold across the Guiana Shield and the Birimian belts of West Africa.
A caution on the pattern
Caveat
Sampling targeted priority areas rather than a regular grid, so the pattern partly reflects where geologists chose to look. It is an encouraging relationship to test, not a proven control. The 5,000 sample soil grid will show whether it holds up when sampling is unbiased.
Why fertility matters more than grade
When the target is a large system at depth, the question a first-pass rock chip program answers is not how high the grade is. It is whether the bedrock carries gold at all.
Large deposits do not produce bonanza rock chips
Scale
The Oko deposits next door are bulk-tonnage systems grading around 2 g/t. Systems of that kind rarely return spectacular surface samples everywhere. What they produce is widespread gold at modest grades across several rock types, which is the pattern these results show.
Spectacular samples can mislead
Context
A single very high-grade sample from a narrow vein often signals a small, high-grade structure with limited tonnage. Moderate grades appearing repeatedly across different host rocks are a better indicator of a large mineralising system.
Surface grades understate what lies beneath
Weathering
In deeply weathered tropical terrain, gold near surface is leached and redistributed. Surface rock chips are a poor guide to grades in fresh rock at depth, and low surface results do not rule out stronger grades below.
The bedrock is fertile
Answered
This program set out to establish whether gold is present in the hard rock at Oko North. Gold across four host types, concentrated near the shear, answers that question.
How the district’s deposits were found
Every major discovery in the Oko district came from greenfields exploration over the past five years. None was found by rock chips. They were found by systematic soil sampling and by drilling beneath historic workings, the two steps Liberty is now taking.
| Deposit | Holder | How it was found | Outcome |
|---|---|---|---|
| Oko West (Kairuni) | G Mining Ventures | Airborne magnetics, then a soil program outlining a 6km gold-in-soil anomaly; trenching returned 69m at 5.98 g/t | 4.64Moz Probable Reserves |
| Oko Main Zone | G2, now G Mining Ventures | Drilling of a 2km deformation zone marked by historic pits and shafts | 8.63 g/t Indicated |
| New Oko Discovery | G2, now G Mining Ventures | Drilling on the trend adjoining Oko North | 60m at 5.9 g/t |
| South Oko | Altair Minerals | Soil anomalism, then drilling | 10m at 10.15 g/t |
| Oko North | Liberty Metals | Rock chips confirm hard-rock gold; 5,000 sample soil program underway | Pre-drilling |
The biggest deposit was found by soils
Precedent
Oko West, the largest deposit in the district, was defined by a soil program after airborne magnetics, not by rock chips or by following the workings. Liberty’s 5,000 sample soil program applies the same method along the same trend.
Workings on structure have converted here
Precedent
At the Oko Main Zone, G2 drilled beneath historic pits and shafts along a deformation zone and defined a high-grade resource. Where workings sit on structure in this district, drilling beneath them has paid.
Liberty is at the start of the same sequence
Stage
Fertility confirmed by rock chips, systematic soils underway, then trenching and maiden drill targets. That is the order in which the district’s discoveries were made.
Ground this size is rarely assembled
Tenure
Medium-scale permits in Guyana can only be held by Guyanese citizens and are issued in blocks of 150 to 1,200 acres, with prime ground largely closed to application. Liberty has consolidated 40 of them into approximately 180km².
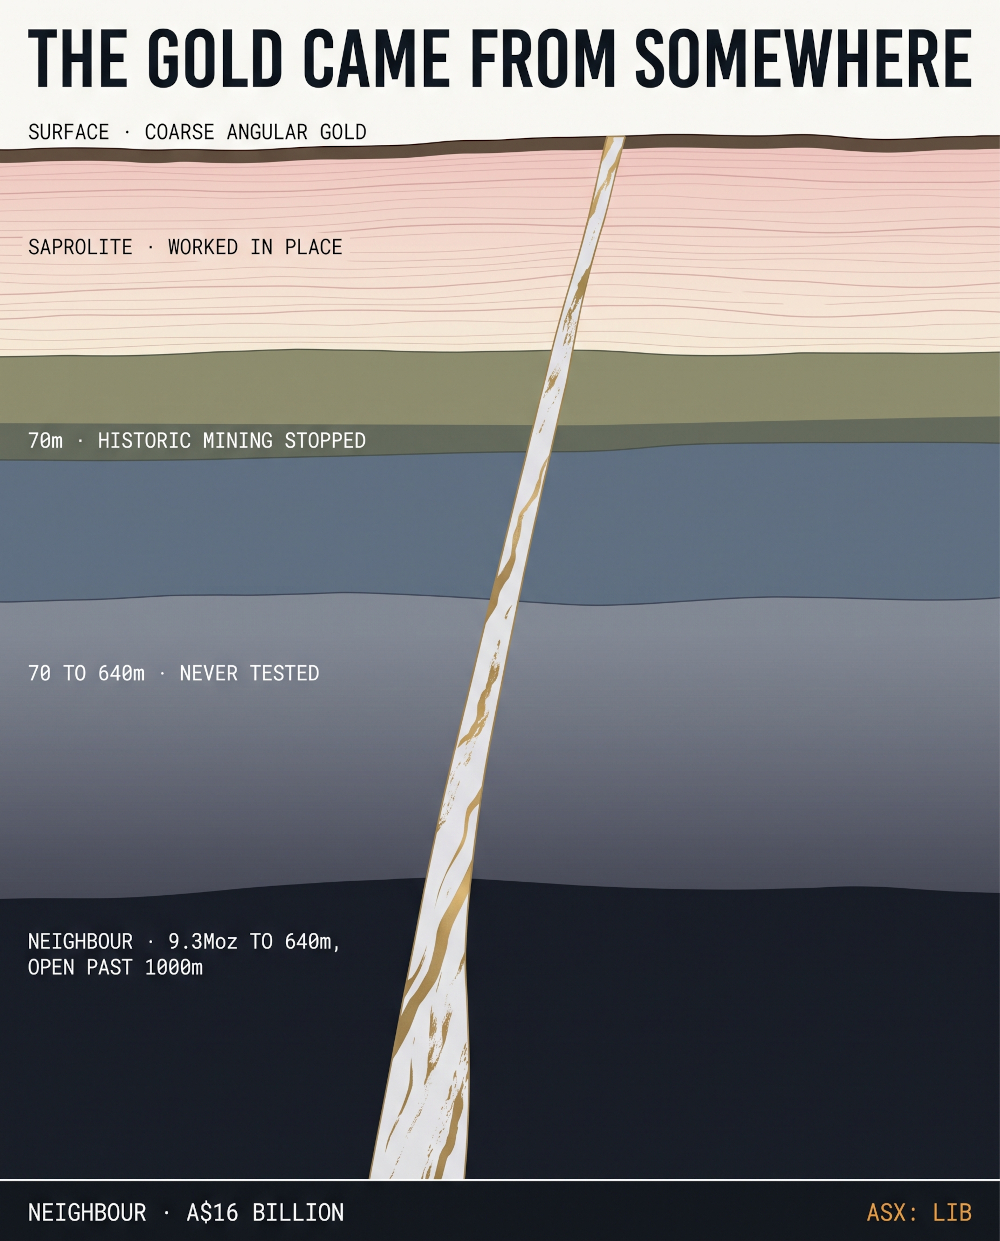
The case for a system at depth
Everything recovered from Liberty’s tenure has come from surface material. The evidence now points to where it came from.
Angular gold has not travelled far
Morphology
Gold carried any distance down a drainage is rounded and flattened. The coarse, angular gold recovered from the workings indicates a source close by.
The bedrock now carries gold
New
The rock chips confirm gold in hard rock across four host types, concentrated near the mapped shear. The source is no longer only an inference from the workings.
Historic mining stopped near surface
70m
Artisanal and historic mining across the district reaches roughly 70 to 100 metres. Nothing on Liberty’s ground has been drilled beneath it.
Next door, the system runs deep
Neighbour
G Mining Ventures’ open pit resource at Oko West extends to roughly 640 metres, with mineralisation reported open past 1,000 metres on its ground.
Depth figures describe ground held by G Mining Ventures, not Liberty Metals, and are drawn from its disclosures. They are not necessarily indicative of mineralisation within Liberty’s tenure. The cross section is illustrative and not to scale.
What comes next
5,000 soil samples across both blocks
Underway
The maiden systematic soil program is running across Oko North and Oko South, analysed in field using pXRF and DetectORE™. It will show whether the rock chip results form a coherent anomaly along the shear.
Maiden field program at Oko South
Soon
No sampling has yet been completed at Oko South. Liberty is preparing a maiden exploration program on the southern block, which covers the interpreted southern continuation of the Oko trend.
Targets for a maiden drill campaign
Objective
Rock chip and soil results will be combined to define and prioritise targets for Liberty’s first drilling campaign at Oko North, testing beneath the workings for the first time.
Important. This report summarises the ASX announcement by Liberty Metals Ltd dated 21 September 2026 and refers to earlier announcements dated 12 August, 21 August and 3 September 2026. Rock chip samples are selective and are not necessarily representative of the mineralisation at the sampled locations or of grades over any width. The Oko West and Oko-Ghanie deposits, the New Oko Discovery and the South Oko prospect are located outside Liberty Metals’ tenure and are owned by third parties. Peer results and depth figures are drawn from third-party disclosures and are not necessarily indicative of mineralisation within the Company’s tenure. Nearby discoveries or interpreted geological similarities do not guarantee exploration success. The Project is a greenfields exploration project, no drilling has been undertaken, and no Mineral Resources or Ore Reserves have been estimated on the Company’s tenure. The distance analysis in this report is the author’s own, based on the Company’s published coordinates and mapping. General information only; not investment advice.